
![]()
The Federal Open Market Committee (FOMC) meeting minutes showed several members made a case for raising rates in June.
![]()
Global stocks had a mixed week. Technology and energy were the best-performing sectors.
![]()
Updates on consumer and producer inflation will highlight a busy week of economic data.

ISM Services:
June (Wednesday)
Service sector sentiment slipped modestly in June but was in line with expectations. Declines in new orders outweighed an increase in the employment component.
- Expected/prior month ISM Services Index: 54.0/54.5
- Actual ISM Services Index: 54.0

FOMC Meeting Minutes:
June (Wednesday)
The minutes from the June FOMC meeting showed a Fed that remains focused on inflation. A few Fed officials saw a case for a rate hike at the June meeting. The potential for a rate increase in the fall remains on the table.

Existing Home Sales:
June (Thursday)
Existing home sales unexpectedly fell in June against calls for a modest increase. Mortgage rates continue to have an impact on monthly sales.
- Expected/prior month existing home sales monthly change: +1.0%/+3.7%
- Actual existing home sales monthly change: ‒2.4%
Equity
Equity markets were mixed last week, as investors wrestled with updates on negations between the U.S. and Iran. The Nasdaq and S&P 500 were both up more than 1 percent while the Dow Jones Industrial Average and the Russell 2000 declined marginally. Breadth was narrower, as the Equal Weight S&P 500 was down slightly. The technology and energy sectors were the best performing areas of the markets, rallying more than 3 percent. Materials and health care were the top laggards, both down roughly 2 percent. International markets came under pressure, with emerging markets down almost 2 percent.
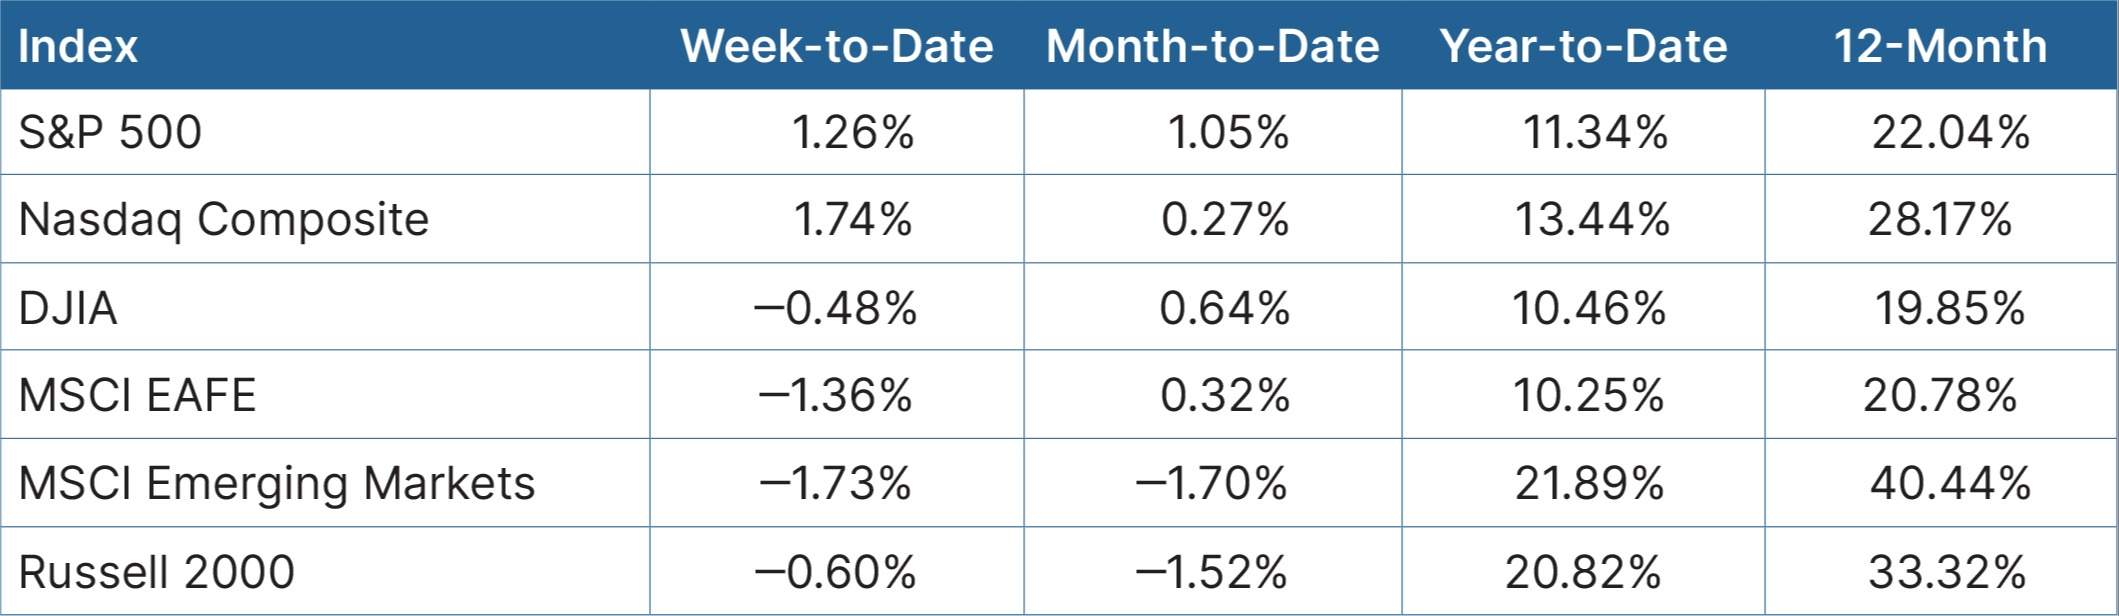 Source: Bloomberg, as of July 13, 2026
Fixed Income
The release of the June Fed meeting minutes again illustrated the potential for interest rates to increase later in the year. Bond markets were weaker, with yields moving higher. The 10-year Treasury bond saw its yield move up by 7 basis points to 4.56 percent. Core bonds and the municipal market were dragged lower as well.
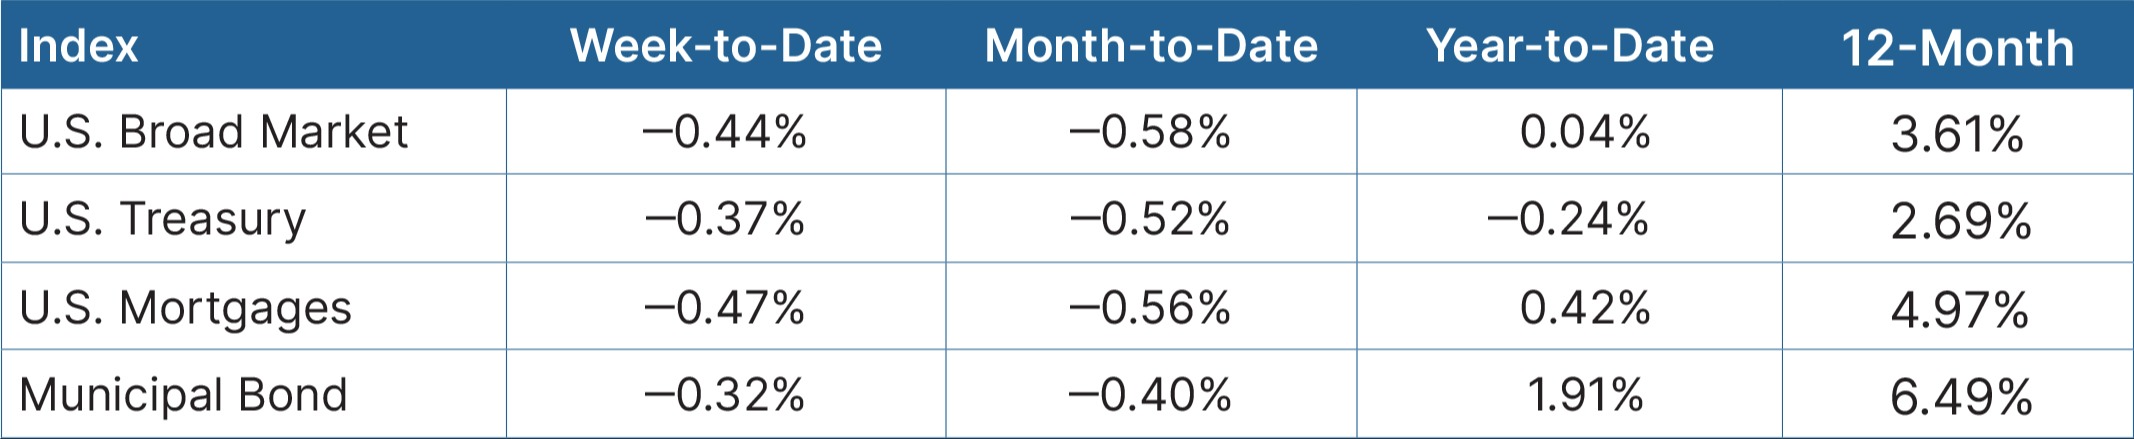 Source: Bloomberg, as of July 13, 2026

Looking Ahead
A busy week for data is highlighted by readings on consumer and producer prices. Both should show a slight improvement due to lower oil prices. Retail sales are anticipated to increase for the sixth straight month, while consumer sentiment as measured by the University of Michigan is expected to improve for the second consecutive month. Earnings season ramps up beginning Tuesday.
- On Tuesday, we expect to see the Consumer Price Index for June. Given the recent drop in oil prices, expectations are that the index will decline slightly from 4.2 percent to 3.8 percent year-over-year growth.
- On Wednesday, we anticipate the Producer Price Index report for June. Expectations are that producer price inflation will also drop slightly from an elevated 6.5 percent in May.
- An update on Retail Sales for June will be released on Thursday. Economists are expecting an increase for the sixth straight month, which bodes well for economic growth.
- The University of Michigan Consumer Sentiment Survey July Preliminary will be released on Friday. Expectations are for a second straight month of improvement off a historic low, as energy prices decline.
- Finally, second-quarter earnings season ramps up, with the banks beginning to report on Tuesday.